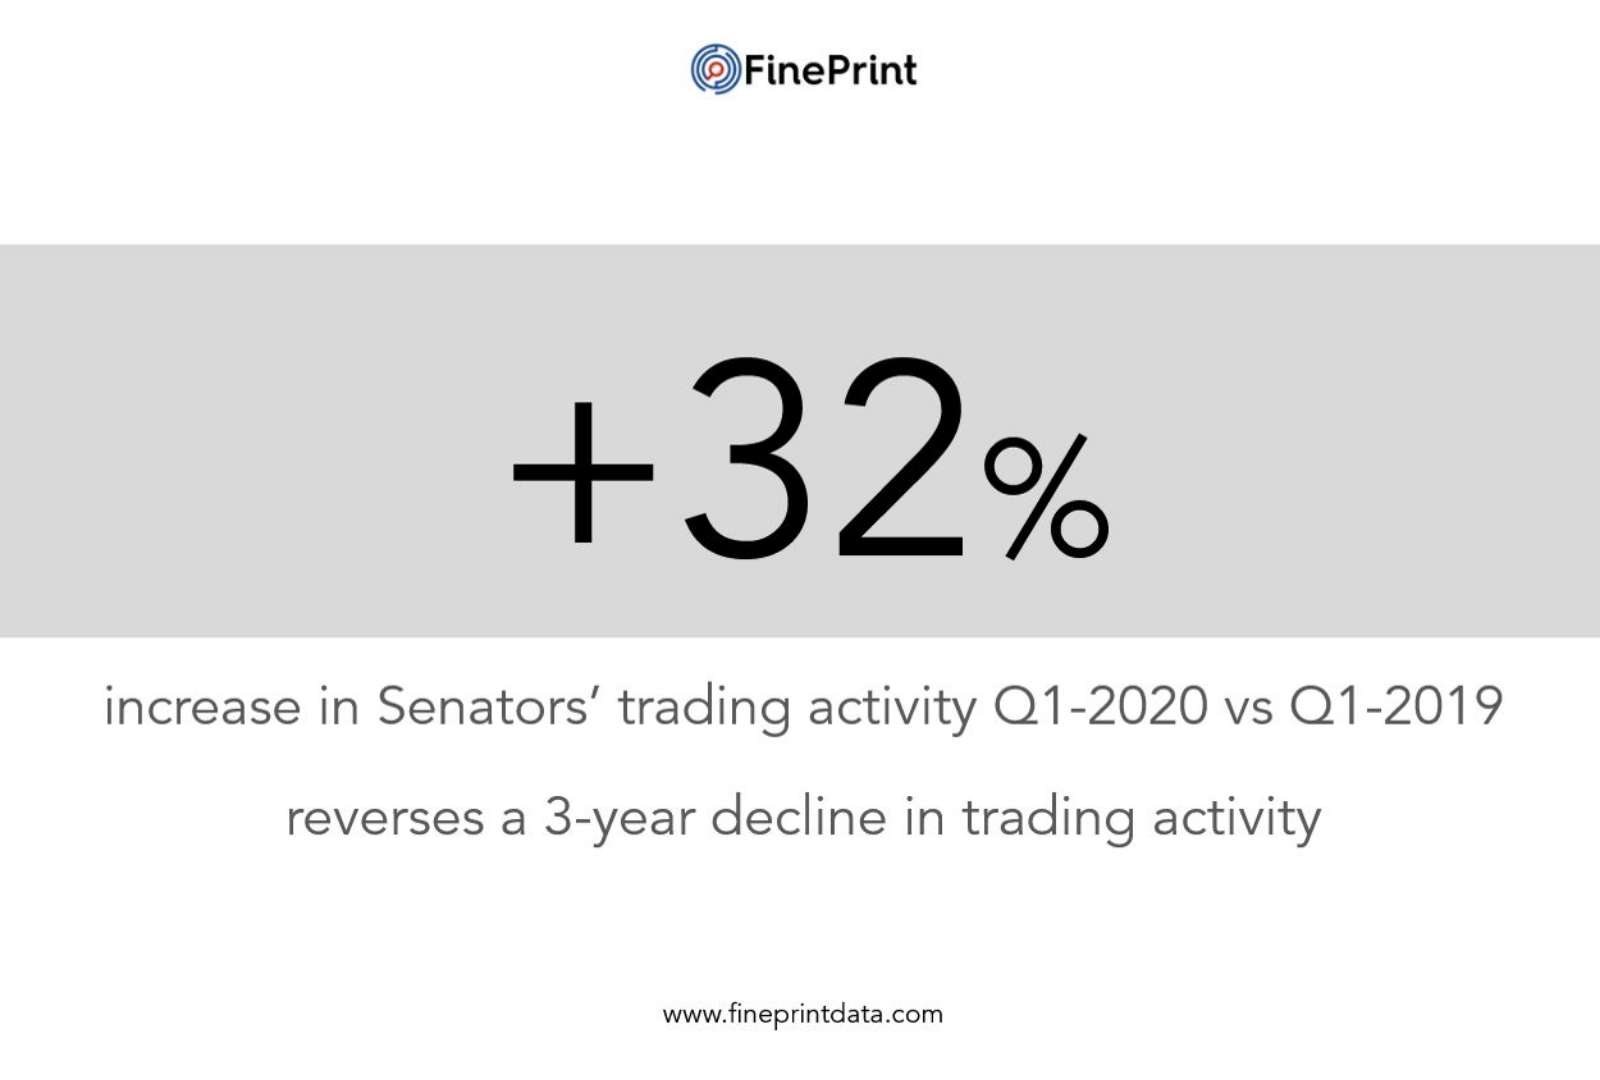
Going forward we’ll be posting regular snippets from our database as we build summary statistics on Congressional Trading activity. The above figure is based on changes in the number of individual portfolio transactions as indicated in the Senators’ Periodic Transaction Reports. Quarter 1 figures for the last few years are as follows:
2017-Q1: 426
2018-Q1: 376
2019-Q1: 340
2020-Q1: 426*
Quarterly data is our preferred method for comparison because of sharp seasonal variation in trading volume. For example, trading volume is often higher in Q4 as investors “harvest” their capital gains/losses, or in Q1 as investors raise cash to pay taxes.
*Note that the 2020-Q1 figure might still go up. As of today (4/14/20) the count is accurate. However Senators have 30 days to report their transactions, and there is some time lag between transactions being reported and the Periodic Transaction Reports being made available to the public. We will update as new reports are made available.